Data display
Here is the output of some of my projects.
Warning!
These files may be slow to load, with thousands of pages. They live in a Google Drive, they are produced periodically and can change at any time.
Source code of the BBand_LAP: github.com/thanasisn/BBand_LAP
Here are all the reports monitoring the data processing of BBand_LAP:
Data processing reports
Clear sky identification
Plots of clear sky identification (CSid) algorithm results. Include both DNI and GHI, but the characterization is based only on GHI (v14.2):
CSid plots
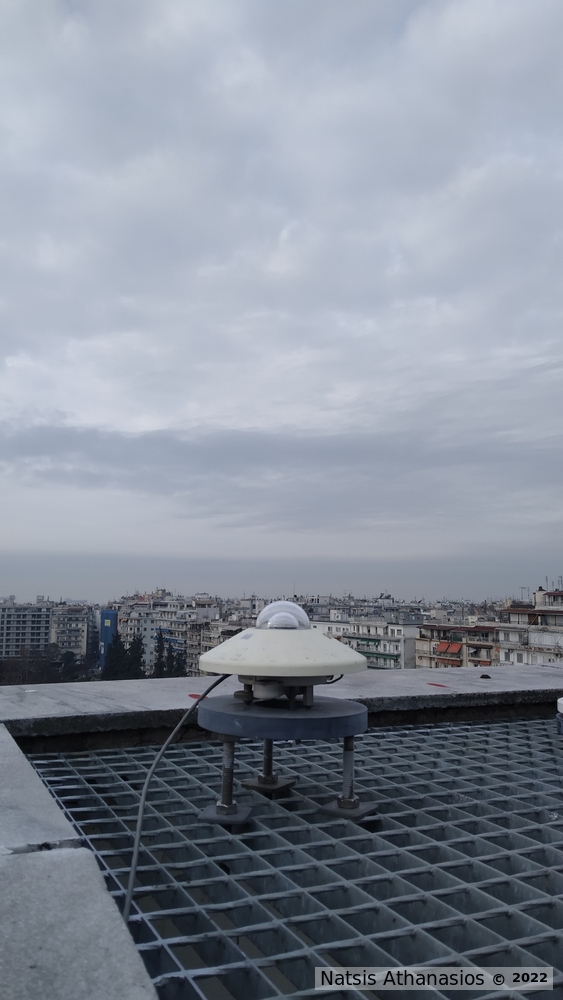
GHI, global horizontal solar radiation
Data from a CM-21 pyranometer.
Plots of the CM-21 pyranometer raw signal:
CM-21 signal plots
Plots of the GHI from the CM-21 pyranometer:
CM-21 global radiation plots
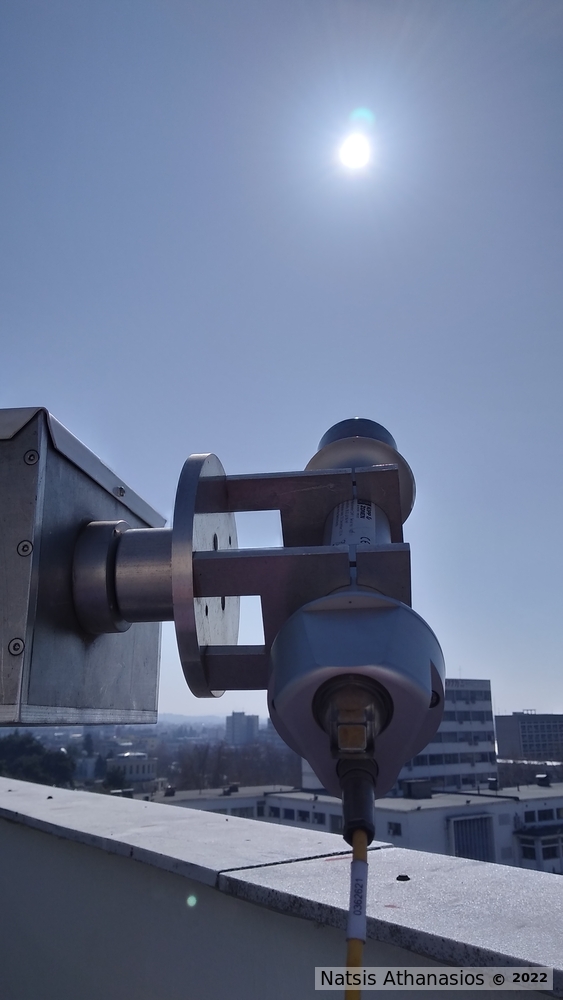
DNI, direct normal solar radiation
Data from a CHP-1 pyrheliometer.
Plots of the CHP-1 pyrheliometer raw signal:
CHP-1 signal plots
Plots of the DNI from the CHP-1 pyrheliometer:
CHP-1 direct irradiance plots
Broad-band signals plots
Plots of the recorded signal of each of the 8 channels/instruments. Each line is “free floating” in the figure, so there are no values on the y-axis. These data are un-managed and the plots may be incomplete. They are intended only for the acquisition process monitoring.
All broadband plots
Some results on the long term trends of GHI and other radiation
This is a reimplementation of the Trends from 30-Year Observations of Downward Solar Irradiance in Thessaloniki, Greece’ A. Natsis, A. Bais and C. Meleti (2023)
This is a work in progress!!
Long term trends
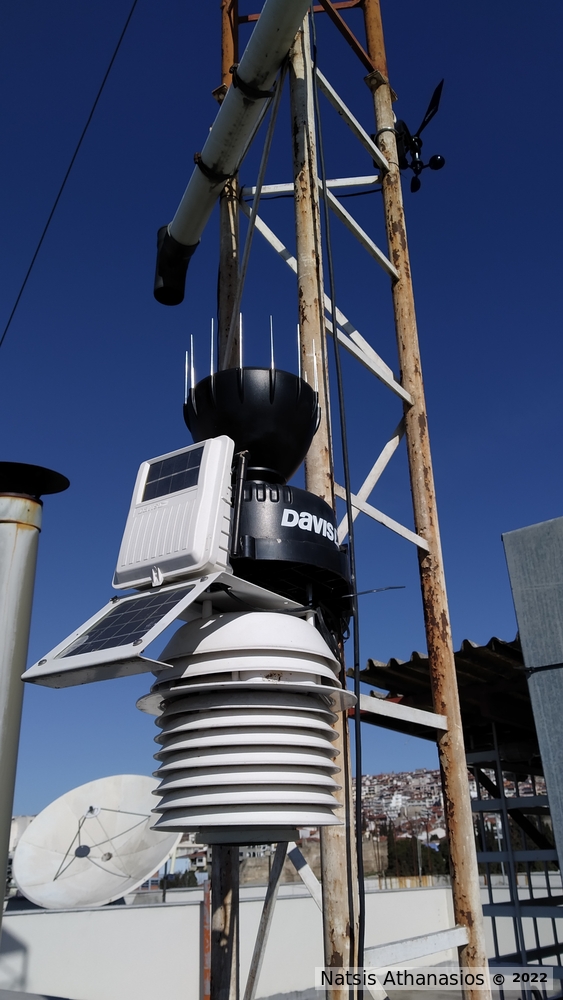
LAP weather station
contact: natsisphysicist@gmail.com
All files should be uploaded daily.
- Weather data is RAW!
- They are not validated!
- Not quality assured!
- Read info files!
Weather data
Live weather data on external web sites